Totango · Platform
Page Builder
Shared platform that compounded into a 38% engineering velocity gain
Summary
Totango accumulated significant design and technical debt following a front-end framework migration, leaving critical legacy features like Scorecards and the Homepage unstable, slow, and misaligned with modern Customer Success workflows. Enterprise customers experienced frequent timeouts and outdated UX, which hindered onboarding and even placed a critical account at churn risk.
My mandate was to resolve these deep performance issues and completely overhaul three major product areas within the upcoming quarter, a goal that was severely bottlenecked by a scarcity of engineering resources.
- I identified a shortcut by partnering with engineering leadership to repurpose an upcoming New Report Builder feature, realizing its backend could be utilized as a shared engine to power all downstream dashboard initiatives.
- I directed the transformation of this local feature into a robust, internal-facing developer library, navigating complex backend alignment around security, data availability, and performance optimization.
- I leveraged this centralized architecture to rapidly design and deploy the revamped Scorecards, a modernized Homepage, and a complex Value Realization Report, significantly reducing the scope of each build.
By treating this internal engine as a first-class product, I successfully delivered all three major customer-facing initiatives on time and achieved a massive 38% increase in end-to-end engineering velocity for my team.
The Context & Problem Space
Totango has several areas that require serious overhaul and reimagination:
- Homepage - a primary tool for Totango power users (Customer Success Managers, or CSMs)
- Scorecards - dashboard with the most critical metrics dedicated to a specific CS program or motion
- Reports - a custom report builder feature focused on tracking current data and historical trends
- Executive Console - a collection of pages dedicated to surfacing Realized Value from different lenses
Significant design and technical debt accumulated after Totango migrated from Amber to React as it’s framework. However, legacy features were not migrated. Over time these features became unstable and outdated:
- The legacy code accumulated patches, the original architecture deteriorated, while the migration from Amber to React remained a large lift with very little reward.
- Customer Success has evolved as an industry, and so did the use cases, while Totango remained committed to the old ways
My team was tasked with several priorities for the upcoming quarter:
Resolve Scorecards performance issues:
- frequent timeouts when loading
- outdated editing UI/UX
Update Homepage:
- build a new version that supports modern CS needs
- provide customization to support Enterprise use cases
Improve the Executive Console:
- build a new page that better captures Value Realization
- provide an ability for external sharing
Approach
The main obstacle for me, as a PM, was the scarcity of the resources: each of the goals could be achieved, as the path seemed straightforward. However, each of three initiative alone would easily take my team more than a quarter to complete.
As I and my Engineering Lead were looking for ways to speed up the process, reduce the scope, or find creative shortcuts, I located a possibility to address the challenge in a way that provided long-term solution to this type of issues:
Another engineering team were just completing a feature they were building for multiple quarters: the New Report Builder. The goal of the initiative was build to replace the legacy Reports feature, and its core functionality is to provide users with a tool to create highly-customizable dashboards that display raw, or processed data in different formats (numbers, charts, tables etc.). Totango already invested a lot of resources into building a new modern backend that coupled with extremely flexible and scalable frontend.
I noticed that each front-end feature that we have on our roadmap can be viewed as a customized dashboard with some bespoke elements and functionality added to it. This means that if we could repurpose the backend and infrastructure that was built for New Report Builder to power my team’s initiatives, we will greatly reduce the scope, In fact, the team estimated that more than half of the scope would be eliminated per feature if the page is powered by the New Report Builder.
After alignment between both Product Manager and both Engineering Leads we agreed on the contract and execution plan:
Phase 1. Research. My team is working on the architecture, requirements, and builds path forward on how to support downstream features, while another team (which built New Report Builder) is confirming the scalability, and creates enablement documentation.
Phase 2. Transformation. Convert the New Report Builder from a local feature into a shared engine with rich internal-facing library and documentation.
Phase 3. Building. This is the stage when Totango starts benefitting for the upfront resource investment, and my team rapidly releases customer-facing features to the public
Execution
Phase 1. Research
I partnered with my engineering lead to estimate the workload on the backend once it powers up the features that we plan it to:
- Scorecards will be sunset and replaced by a special case of New Report.
- Legacy Homepage will be sunset, and the new feature will be powered by the new engine.
- Completely new page in Executive Console called Value Realization.
The team that built the New Report Builder ran extensive workload tests and confirmed that scalability will not be an issue. The enablement between the engineers was completed, and the original contract between the engineering teams was finalized.
Phase 2. Transformation
Both teams were working on this transformation, resolving issues like security, data availability, caching, performance optimization and others.
One of primary areas of my focus at this stage was managing stakeholder expectations to ensure alignment, since there is almost no content to demonstrate the progress during backend-heavy development cycles.
However, thanks to detailed multi-step plan I was able to track the progress and navigate the conflicts.
The New Report Builder became an engine that other teams were able to use to power elements on any Totango page 1 sprint ahead of the plan. QA took another 2 sprints to confirm all edge cases.
Phase 3. Building
Scorecards
The first goal I set for the team at this stage was to replace Scorecards:
- Enterprise customers complained about slow loading time, which in some cases resulted in browser session timeout.
- New user onboarding was hindered by an outdated UI/UX.
- Multiple legacy bugs were on hold, waiting for a feature rewrite.
- One critical Enterprise customer was at Churn Risk directly due to Scorecards performance.
Report-as-a-Scorecard User Flow
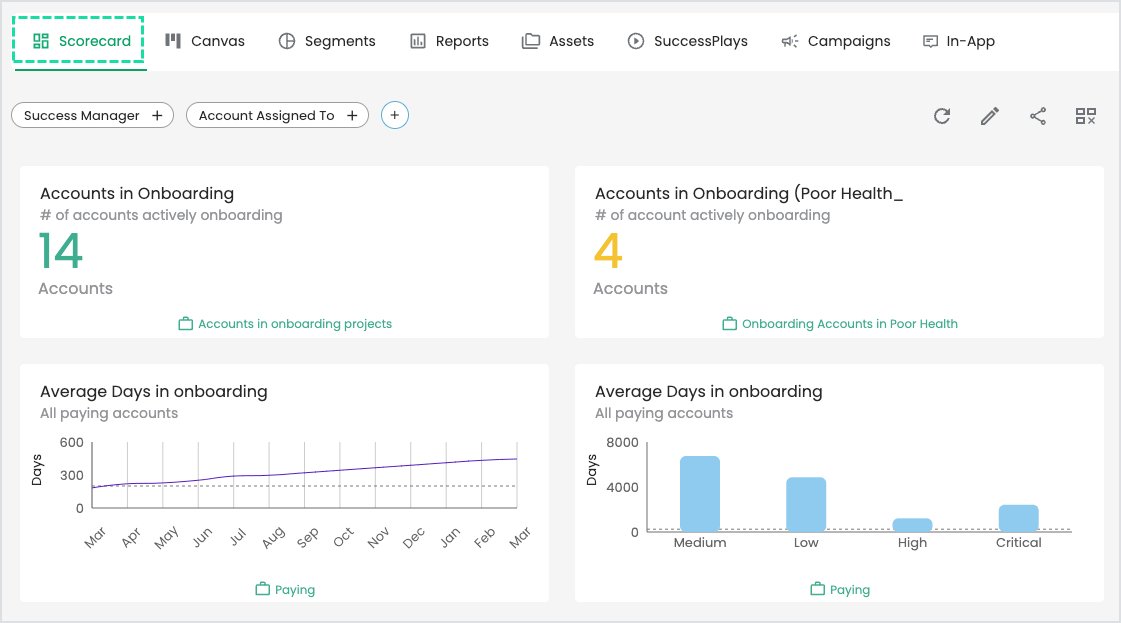
Definition: Scorecard is a dashboard consisting of KPIs of different visual types that surfaces the most critical performance information related to a specific CS initiative or goal (also known as SuccessBLOC).
First, user builds each KPI individually (the visual type, the underlying data, etc):
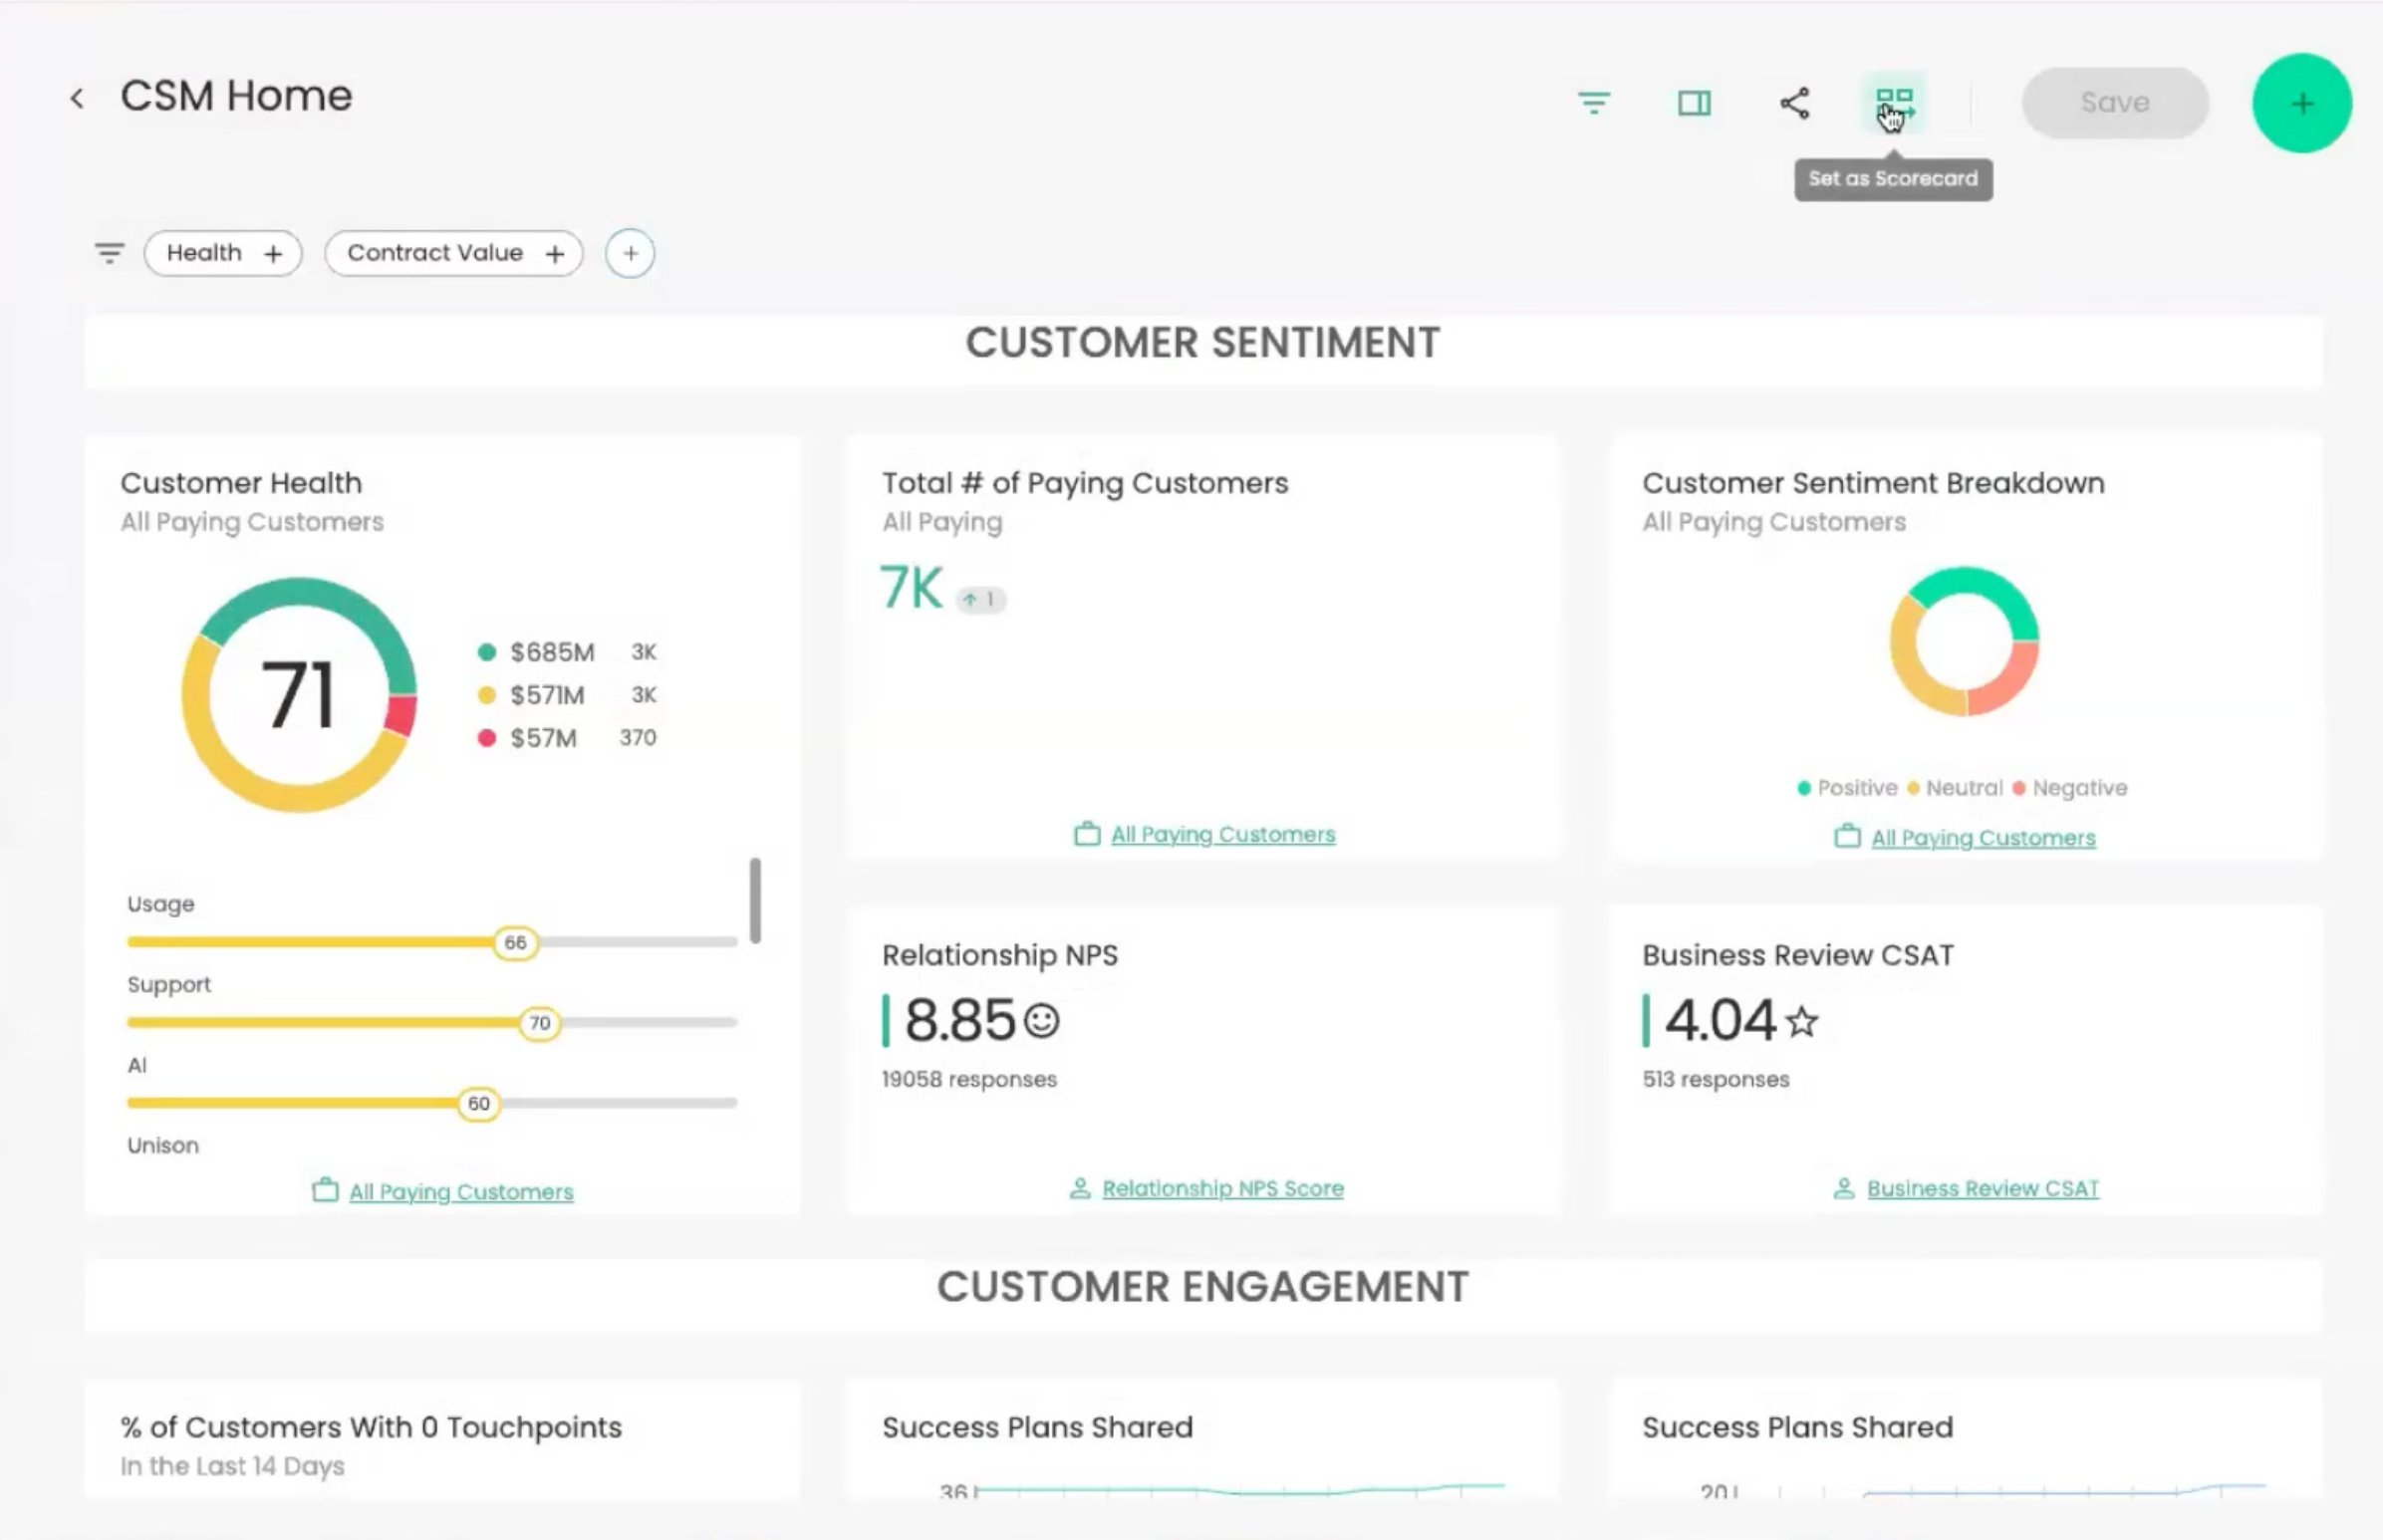
Next, the report is published as a Scorecard:
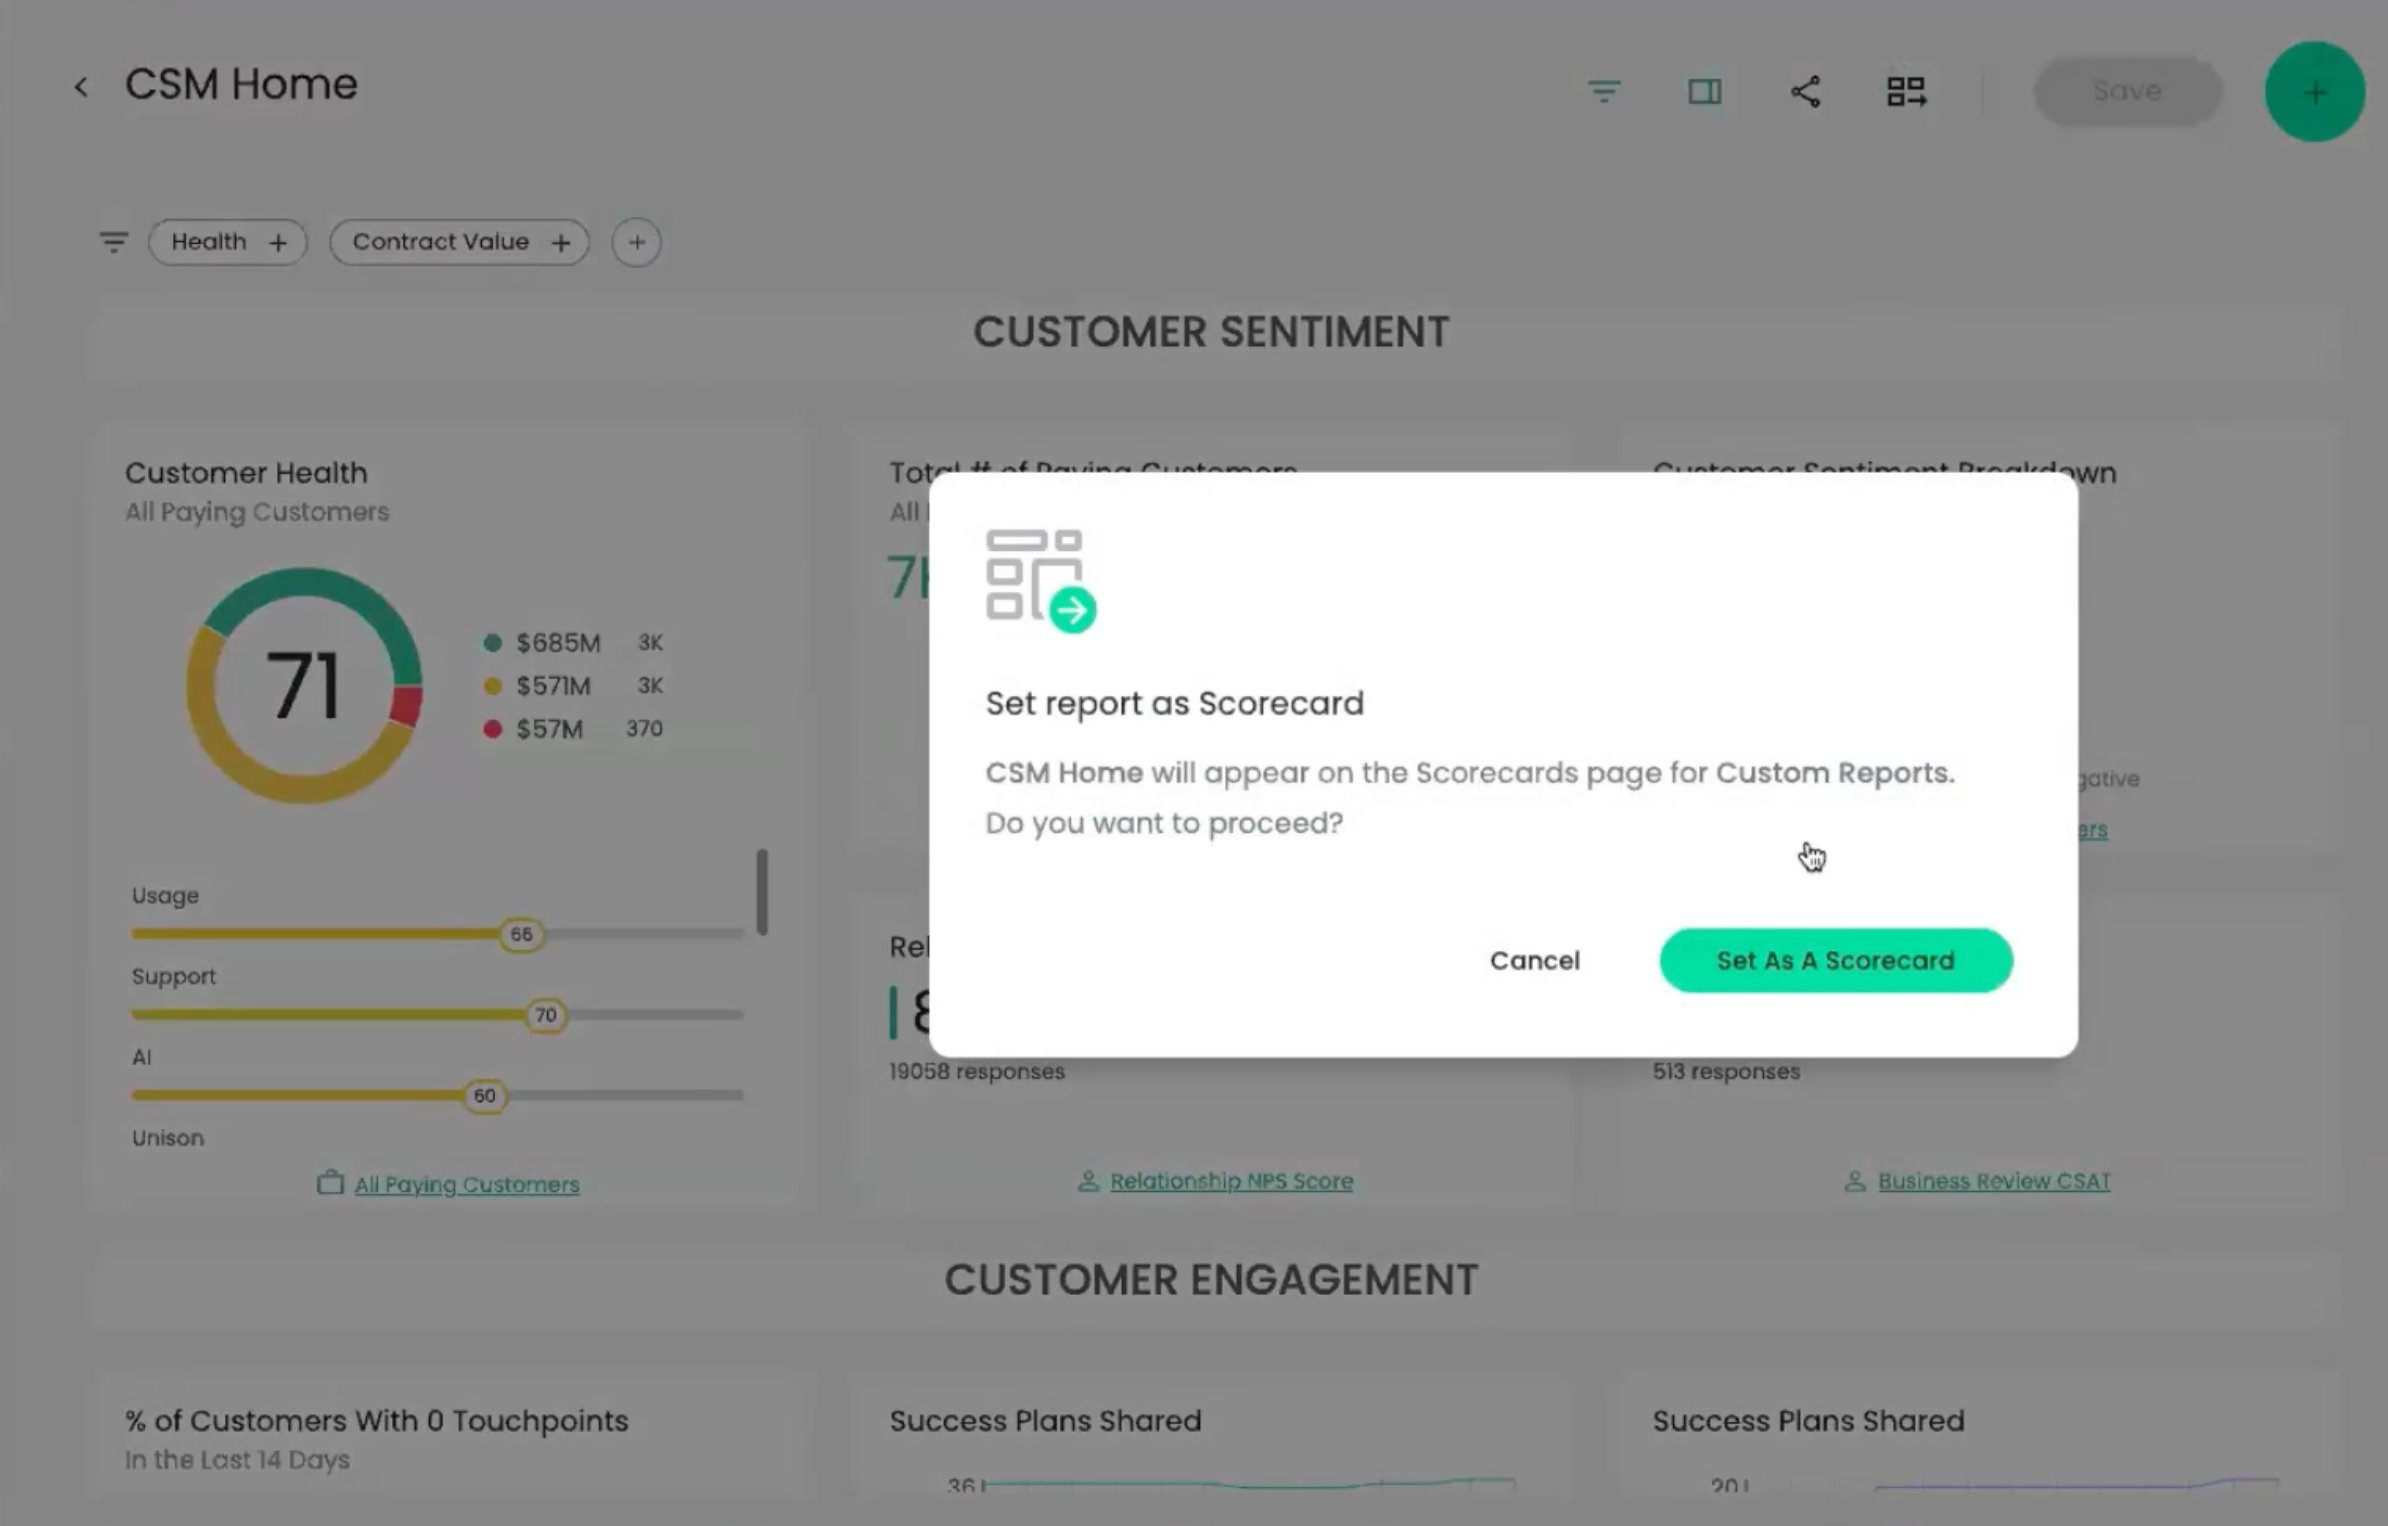
As the result, it becomes visible for everyone who has access to this CS program (SuccessBLOC):
Alternatively, a user can start building Scorecard (which is actually a Report under the hood) from empty Scorecard state.
By routing the new Scorecard creation through the shared Report Builder engine, I eliminated the need to build a new tool from scratch. This release allowed me to instantly clear the backlog of legacy bugs, deploy a modernized UI on time, and successfully save the at-risk Enterprise account.
Homepage
Next, I shifted my focus to the New Homepage initiative. As stated before, the goal was to address the evolved Customer Success nature, and provide the best-in-class tools for Totango power users.
I partnered with the designer, and we came up with two distinct, purpose-built features: My Business (for assessing account health, risk, and renewals) and Workspace (a central hub for prioritizing daily workflow, tasks, and notifications).
This was the first real test of my initial architectural assumption. I mapped the requirements for the new pages and identified that these interfaces were essentially specialized KPI cards.
By directing the team to utilize the shared backend engine, I reduced the development scope of this feature by 50% compared to building it anew.
Value Realization Report
The final deliverable of this initiative was the Value Realization Report.
The core purpose of Totango (or any Customer Success Platform, for that matter) is to ensure that customers achieve their desired outcome by utilizing your product or services, as this is what drives renewals and expansion.
The Value Realization Report required highly complex data visualizations, including dynamic scatter plots, stacked bar charts, and nested top line filtering.
Thank to my approach of leveraging the shared Report Builder engine, the team inherited all this complex charting infrastructure for free. This architectural shortcut allowed me to ship an executive-grade reporting feature on time, praised by QA for its stability, with zero deployment issues.
Impact & Outcomes
38%
Engineering velocity gain
End-to-end build time reduction across the team
3 out of 3
Initiatives shipped on time
Scorecards, Homepage, and Value Realization Report
I successfully delivered all three high-stakes initiatives (Scorecards overhaul, Homepage modernization, and the Value Realization Report) on time, which was impossible under the original resource constraints.
For the Quarter Retro meeting I calculated end-to-end development savings post-launch, which turned out to be a 38% reduction in build time across the team by leveraging the shared engine.
Fundamentally shifted how the engineering team approaches discovery. All future feature scoping is now systematically divided into library-powered vs. bespoke builds, ensuring compounding time-savings for the company.
Resolved the instability of the legacy architecture. The new features launched with zero deployment issues and were specifically praised by QA for their remarkable stability, neutralizing the performance-related churn risks.
Key Takeaways
The Anxiety of Upfront Investment. Transforming a local feature into a shared library requires a significant upfront investment of resources before a single piece of customer-facing UI is shipped. It is an anxious period because there is no way to immediately validate assumptions with end-users. However, committing to thorough discovery and architecture planning in Phase 1 is what ultimately unlocked the massive, compounding velocity the team achieved in Phase 3.
Internal Engines are Products Too. Building tools and libraries for internal engineering teams is remarkably similar to building features for external customers. To be successful, this shared engine must be treated as a first-class product. It requires dedicated product management, comprehensive documentation, and ongoing investment to maintain its usefulness and prevent adoption bottlenecks.
Compounding Engineering Velocity. Once the core library is established, the downstream benefits are staggering. By centralizing the infrastructure, we received complex functionality (state preservation, caching, editing permissions etc.) essentially for free on every new page. Furthermore, it drastically reduced the QA burden, as the testing surface area was significantly smaller for each next feature release.